
sand

![]()

Try simulations easily (github). https://sand.bettercallshao.com/
Why does this exist?
In college, I enjoyed playing with dynamic solvers, including LT-SPICE, Ansys, SolidWorks, but most of all MATLAB / Simulink. One day, I was trying to explain to my wife (a financier) how to use Gain Margin to gauge the stability of a system, ending up having to explain what is a linear system and a state space. It came off as very vague and mystical, but I rather believe a second order linear system is the simplest system to study properly and rationalize about, and one can gain a great deal of confidence in the natural world by understanding a linear system. But most people don't learn it in school, and instead rely on conventional wisdoms of various kinds to dictate their everyday decision making. Therefore, I am trying preach the useful concepts arising from studying linear systems, and sand is created as an accessible tool capable of simple simulations that helps with the preaching. For serious scientific research, I believe Simulink is great, and Xcos is a great alternative.
How do I use this?
Use the app by making an Diagram, setting Initializations, then observing Graphs, and finally Sharing it with your friends.
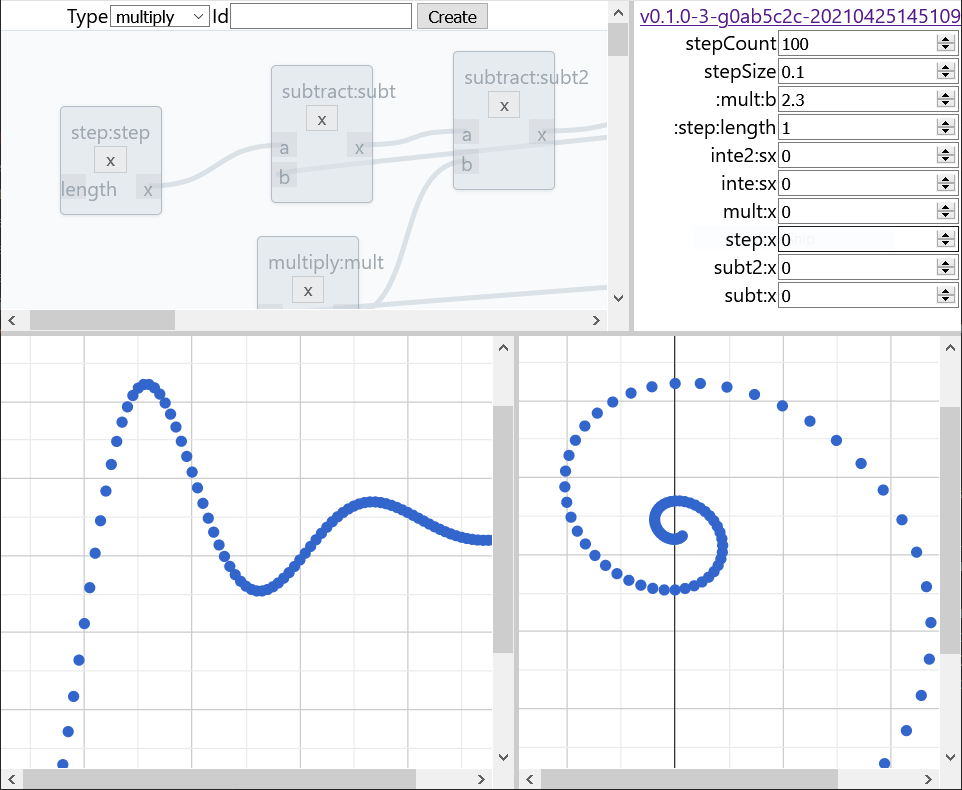
Diagram
Top left quadrant is a System diagram composed from different Types of Boxes (aka transfer functions) of unique Ids. Each box has many Ports, representing Variables, with inputs on the left and outputs on the right. Linked ports share the same Variable. A system can be simulated given initial values.
- An initial 2nd order with step input is generated by default.
- Boxes can be crated by selecting a type and an unique id.
- Boxes can be removed by clicking the X in the box.
- An input port can be linked to an output port by dragging.
- Links can be broken by double clicking.
- Box types are predefined in builtinBoxType.js.
Initialization
Top right quadrant is Initialization assigning each Variable an initial value. A variable is named after the output end, unless it represents only an input, in which case the name starts with a ":". stepCount and stepSize are special configs for the solver.
Graph
Bottom quadrants are scatter plot Graphs of variables against each other. length is a special variable representing time. Whenever the diagram or initialization is changed, the system simulation is rerun, and results are updated on graphs.
Sharing
The app is always saved in the URL itself. The URL alone captures all of the states, and can be bookmarked or shared. Since the URL is long, for a better sharing experience, consider shortening it with tinyurl. E.g.
- 2nd order with step input: https://tinyurl.com/h4t3r7a7
What next?
- More box types, e.g. Dirac, division, square, triangle, etc.
- When states are long, URL may explode. Probably need another way to share.
- The diagram library is kinda ugly, especially the links don't bend gracefully and get hidden behind the boxes.
- Link creation is not validated, connecting two inputs or two outputs doesn't make sense and will make the system invalid.
- Convergence of state is not detected and the solver always runs certain number of steps.
- Whether a box is "constant" type or "persistent" type is not conveyed to the user. This is a key point in understanding the system and how the solver works.
- Whether a variable is "constant" or "persistent" is similarly also not conveyed. Initialization an output of a constant box is pointless because it is overwritten every step. Maybe hide these from the initialization form.
- Maybe rename "length" to "time". "Length" is used because the base could be something else, e.g. the length of a beam.